Share The Dream at UMass Dartmouth

Bottom Line students at the Share The Dream Banquet, Feb 2013

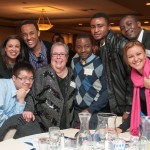
Bottom Line students at the “Share The Dream” banquet, February 2013

This past February, I had the privilege of attending the annual “Share the Dream” banquet for students in the College Now/START program at UMass Dartmouth. Carol Spencer, Director of College Now Program, said that it is held every year to, “celebrate the success of the College Now/START Program.” The first-years are “officially welcomed into the University by receiving a certificate acknowledging their completion of the program.”   Staff say that, “The Banquet is a wonderful way to celebrate and empower our students to continue striving.”

College Now/START is an alternative admissions program that supports students throughout their first year of college, by providing additional academic support and mentoring. Many Bottom Line students are enrolled in this program and have begun to see the benefits of taking a reduced course load and attending extra tutoring hours their first two semesters of college. There are currently 30 first-year students from Bottom Line in College Now/START Program, and 52 Bottom Line students have participated since 2009.

My student, Etiene, was asked to be one of two current College Now students who gave a speech at the banquet. In the days leading up to the event, he said that he was nervous and yet his speech was ready, thanks to the support of his College Now advisors and the Writing Center. At the “Share the Dream” banquet, Etiene brought the crowd of students, parents, faculty, administrators, and supporters to their feet! I could not have been more proud of him and was truly moved by his speech.  Etiene was also awarded a $3,000 Talent-Merit Scholarship from College Now.  It was a testament to his hard work this past semester.

Etiene, as he gives his speech at the Share The Dream Banquet

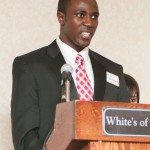
Etiene, as he gives his speech at the “Share The Dream” Banquet

I believe that alternative admissions and bridge programs at colleges are great options for hardworking and determined students who need more help preparing for college. UMass Dartmouth is not the only school with these types of programs. Students can often find summer programs or first year intensive programs that will help support their academic needs. Programs such as Passport at College of the Holy Cross, AID at Worcester State, OTE at Boston College, and PLUS at Framingham State are all great examples of alternative admissions or bridge programs.

Some students are discouraged or disappointed to find out they have been selected for such programs because they may have to take a reduced course load, spend a few weeks of their summer taking college classes or attend mandatory tutoring sessions. These students should be excited for such programs! Not only do they offer lots of academic support in order to succeed in the first year of college, but a chance to build stronger relationships with peers and school administrators with which many students to not normally get the chance to interact. Bridge programs help students gain comfort with the rigorous coursework found in many college-level classes and understand what the rest of their years in college will look like. Over 90 Bottom Line students from the high school Class of 2012 went on to attend bridge programs at Bottom Line’s target colleges.  I love it when our students are able to take advantage of existing resources to better handle the transition to college and help them reach graduation.

– Kira Terrill

Success Counselor, Worcester

, , , , , , , , , , , , , , , ,

“I have to do the FAFSA again? But I did that last year!”

Success Counselor Ali Lincoln and her student, Robert

Senior Success Counselor Ali Lincoln and her student, Robert

It’s financial aid renewal season for Bottom Line Success counselors, and as many of our first-year students are finding out, it’s something that happens every year of college. Initially, it seems like a piece of cake, since there’s only one school to worry about instead of the ten schools they applied to last year.  However, financial aid renewal is a multi-step process for most of our students that typically drags on throughout the whole semester. Even within the same school, some students have different requirements, and my email inbox has been steadily filling with panicked messages about missing documents, requirements that have already been fulfilled (or so a student thought), and upcoming deadlines.

Counselors start by looking at deadlines for each school that they work with, and make sure to schedule time to help students file their initial FAFSA before each deadline. Essentially, resubmitting information from the current school year’s Student Aid Report shows intent to attend and receive aid the following school year.  Schools want to ensure that each student receives the aid that they deserve and they each decide how the student proves their income.  The school may require an online or paper form sent, a tax transcript submitted, CSS Profile, or IDOC be completed to confirm income.  Accordingly, Bottom Line counselors review these ever-changing financial aid applications with our students.

After students and their households have received 2012 W2s, 1099s, and filed their taxes, counselors help students update their FAFSAs. Students may be selected for a process called verification, and be required to submit additional forms, their passport, or tax transcripts. Some students are able to use the Data Retrieval Tool, which directly links tax information from the IRS to the FAFSA. Not every student can use this, and then they need to request tax transcripts online, over the phone, or in person. Often, the deadlines for these follow-up steps aren’t as clear as the priority financial aid deadline at a school, but delays in these steps can severely affect a student’s aid for the following year.

Financial aid renewal is an intimidating process; missing a step or turning in something late jeopardizes a student’s ability to pay for school. Bottom Line counselors diligently help students through every step of this long, annual process, and we’re also working to help our students become better self advocates and take on more personal responsibility when it comes to financial aid. We’re helping them stay on top of deadlines, coaching them through calls with financial aid, showing them where to find the forms they need and how to fill them out, and following up to make sure that all of their questions are answered. It’s a lot of work, but staying in school and on track to graduate is a great motivator!

– Ali Lincoln

Senior Success Counselor – Worcester, MA

, , , , , , , , ,

The Devil is in the Data

Justin Strasburger - Worcester Site Director

Justin Strasburger – Worcester Site Director

It’s no secret that here at Bottom Line, we love data! In my mind, the best use for our data is to help us evaluate our programs, make necessary adjustments, and ensure the highest quality service for our students. It was with this in mind that, last summer, we took a look at the way we track the services we provide our college students.

Tracking our Success program poses a challenge because each student requires such individualized support. Without good data, it is hard to see patterns that allow us to take a more proactive approach with our students. What we came up with was a system to formalize the services we were providing to students: Success Service Plans. The concept was pretty straightforward: counselors would be able to plan out a semester’s worth of goals and corresponding services for each student and track them in our database. This allows counselors to think ahead and keep track of any follow up that needs to happen.

The Service Plan system we developed also provides us with a huge amount of data to better understand our students’ needs and our program’s capacity to meet these needs. A good example of this is the way we plan out campus visits. In the past, we have planned campus visits by school year and DEAL (Degree, Employability, Aid, and Life) color status (Green, Yellow, and Red).

We  allocated roughly three in-person meetings for 1st year students and students who were Red or Yellow. Typically, we had two in-person meetings with Green students. While this has never been set in stone, this assumption was necessary from a planning standpoint so that we could allocate our time appropriately. We all recognized that it was not as simple or clear-cut as saying that all students get two or three on-campus visits. Some may need more in-person meetings, while some may need less (but potentially more follow-up services). Without clear data, though, it was difficult for us to know if these assumptions made sense. Introducing Success Service Plans for each student has allowed us to truly move our program away from a one-size-fits-all approach.

While we are still completing our biannual assessment process, I have began to run some reports to see what the Success Service Plan data can tell us about the Fall 2012 semester. Here is what I found:

¨       Bottom Line’s 1,391 Success students (this does not include students who are currently not assigned to a counselor) received 8,876 total services, an average of 6.38 services per student.

¨       Of these services, 5,523 (or 59%) were in-person services (either occurring on campus or in our offices). This is a per student average of 3.76 in-person services (already above the 3 campus visits we have planned for our neediest students).

¨       The percent of total services provided by class year, is pretty close to the percent of total students by class year with the exception of Seniors. For example, 1st years account for 36% of Bottom Line’s students and accounted for 38% of the total services. Seniors account for 12% of Bottom Line’s students but accounted for only 6% of the total services. This is not terribly surprising as part of our work with Seniors is to help them become more self-reliant. This means that they likely required less follow-up services.

¨       Our Red (22%) and Yellow (22%) students received far more in-person services than Green students (14%).  On average Red students had 4.51 in-person services and Yellow students received 3.79 in-person services.  This information will help us to better plan out our campus visit needs.

I also took a look at services completed by college attending. To avoid small sample sizes, let’s consider colleges where Bottom Line has at least 25 students. We have 18 schools that fit this description: 10 public and 8 private. Despite this fairly even distribution of public vs. private schools, services were not as evenly distributed. The top 6 schools in terms of average services provided per student are all public schools. This is likely due to a higher concentration of Red, Yellow, and 1st year students at these schools. We can use this information to potentially allocate more time to a school like UMass-Lowell, where students required an average of 5.31 in-person services, than a school like Northeastern University, where students required an average of 2.66 in-person services.  It also shows that we need to do further analysis to make sure we are adequately serving all our students.

In a lot of ways, this data confirms our assumptions. It is important, however, that we are not working off of assumptions and instead base our plans off of data.  This body of information becomes increasingly valuable as Bottom Line continues to grow. As we expand into new markets and grow the number of students we are working with, thoughtful planning will be very important. While moving to the Service Plan system took some adjusting, I am confident that it will continue to prove a useful tool for counselors to more thoughtfully plan out their semesters, and for management and program development teams to better plan our curriculum and program implementation.


Justin Strasburger

Worcester, MA- Site Director

, , , , , , , , , , ,

New study shows more Boston Public School graduates finishing college


An exciting report that was released on Thursday, January 17 and was featured in The Boston Globe and on WBUR. According to the report by the Center for Labor Market Studies at Northeastern and commissioned by the Boston Foundation, the 6-year college graduation rate for Boston Public School graduates increased from 40% to 47% between the high school graduating classes of 2000 and 2005. In addition, college enrollment and persistence rates have increased steadily since 2000.


When Bottom Line was founded in 1997 here in Boston, it was because we could see that students lacked the support, guidance and preparation to succeed in college. In the 16 years since then, we have been dedicated to changing the outcomes for those students, and we have been joined in our efforts more recently by many others in the community who have also recognized this significant challenge. This report acknowledges that we have made real progress in preparing and supporting our students so they can be successful in college and beyond. From the class of 2005, nearly 7% of all BPS degree earners received Bottom Line’s support throughout college. Our guidance played a critical role in the success of those students.


However, for our organization and for the community as a whole, our work isn’t done.

 Even with this progress, more than half of college-enrolled BPS graduates still were unable to earn a degree in 6 years. However, we have continued to grow every year since 2005, and we will continue to expand so that we can make a real, significant impact on our students and the community moving forward. The size of our class has tripled between 2005 and 2012, and, within the next two years, we will grow to serve 450 Boston Public School graduates from each high school class year, in addition to students from the Greater Boston and Worcester areas. With this growth, we hope to play an even larger role in the progress of our students and our community moving forward.


Mike Wasserman

Executive Director – MA

, , , , , , , , , , , , ,

Winter 2012 Annual Interesting Report – What effect does finanical aid have on graduation rates?

Bottom Line prides itself on being proactive about the services that we provide to our students.  Our goal is to empower staff at Bottom Line to think critically about our services using the data we collect during the school year. We want to ensure we are supporting our students in the best possible way.  This past spring, Worcester College Access Program Manager Michelle Easton took a closer look at our students’ financial aid data.  Michelle was curious to see how the decisions a high school senior makes regarding financial aid impacts their likelihood of graduating from college.  The result is our first Annual Interesting Report (AIR for short).

An excerpt from our first Annual Interesting Report:

“Financial aid can make or break a college education.  Despite having the best grades and work ethic, a student who is unable to pay for college will be unable to continue their education.  This seems so obvious, and yet many of the students we work with at Bottom Line struggle to fund their education.  Many of our students and their families try their hardest to make college a reality, but are often unable to sustain such great expenses year after year.  In order to best advise our high school students in their final college choices, I wanted to dig deeper and fully understand how financial aid impacts our students.  In the spring of 2012, I sifted through our data to analyze over 130 students’ financial aid outcomes, and confirmed that financial hardship had a significant, negative impact on college graduation rates.”

The complete report is available here: 2012 Winter AIR – What Effect Does Financial Aid Have on College Graduation Rates

, , , ,

Worcester Community Comes Together to Support Local Youth

Last Wednesday, 100 guests joined us at Mechanics Hall in Worcester for our third annual Get In, Graduate, and Go Far Reception. Now in our fourth year of operation in Worcester, Bottom Line has continued to grow and expand: we serve 150 high school students and 165 college students locally. On Wednesday, we were lucky enough to hear the stories of two of those students, Crismel Calderon (a senior at Assumption College) and Fredery Muñoz (a first-year at College of the Holy Cross). Their stories of resilience remind us why we all support Worcester’s youth. Thank you to the Worcester community for helping us guide Crismel, Fredery, and hundreds of other determined students to and through college. Below are videos of Crismel and Fredery’s speeches.

, , , , , ,

A visit to Washington D.C. for the National College Access Network (NCAN) conference went from educational to exciting for our staff when Bottom Line was chosen as the winner of the 2010 College Access Organization Award of Excellence.  The announcement was made at the awards luncheon on Monday, October 11th by Kyle Malone, Senior Program Officer at USA Funds.  This was the 5th year of the award and it comes with a $5,000 Donation from USA Funds.

As just one of nearly 300 members in NCAN who represent a variety of programs and services focused on college access and success we are thrilled that our work with thousands of students in Boston and Worcester has been recognized so highly.   We believe that our model of one-on-one support is necessary to improve the low college graduation rates for our population of disadvantaged students.  Currently we have a college graduation rate of 73% and we are on track to make it even higher.

From start to finish, the underlying theme of the conference was persistence through college.  Many of the sessions and the key note speakers, Jim Applegate of the Lumina Foundation and Martha Kantor, the under-secretary of Education focused on this issue in their remarks.   Because Bottom Line has been focused on college graduation since our inception we are hopeful that our selection as the winner of this award will further demonstrate that “getting in” is not good enough.

Thank you to the committee of voters from around the country who selected Bottom Line! We are honored by our selection and look forward to living up to the high standards this award represents.

Greg Johnson
Executive Director

, , , , , , , , , , , , , ,